Math 183, Final Exam, Winter 2021, Quarfoot
Hello, dear friend, you can consult us at any time if you have any questions, add WeChat: daixieit
Math 183, Final Exam, Winter 2021, Quarfoot
1. Make sure you have read the Exam Info document (Canvas ● Files ● Final Exam Materials) that explains which materials are fair to use, and which are not.
2. This exam is due at 9 PM Pacific Time on Monday, March 15th, 2021, with no grace period for late submissions. Upload to Gradescope, as you do with homework. Like with homework, you’ll be asked to demarcate where each solution is as you go through the upload process.
3. Remember that a list of typos, clarifications, and common student questions is maintained on Can- vas/TritonEd as an Announcement. You should read this before writing an email to me. I will answer email every few hours between 9 AM and 5 PM while the exam is in progress.
4. Show all of your work; no credit will be given for unsupported answers. Make sure to include units on all answers, when appropriate. Also, remember to simplify all answers.
5. As with homework, you may either give exact answers or round to three decimal places, unless the problem forces an answer format. Also, on R questions, you should always list your code and any printouts/visualizations (either re-created by hand or using screenshots).
6. Point values are indicated next to each part of each problem. There are 8 problems and 48 total points possible.
[4 points] 1. For Christmas 2020, a friend got me a fact-of-the-day calendar, and I’ve been faithfully looking at new facts each day in 2021. The below fact from the weekend of January 23/24 caught my eye:
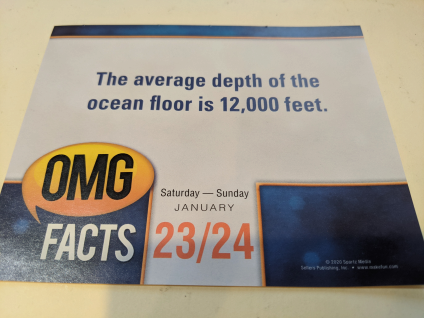
We can use this fact as the starting point for a more serious approach to thinking about ocean depths. Suppose we assume that the depth of the ocean floor under a random place in the ocean is normally distributed with mean 12000 feet and standard deviation 4200 feet. Now, suppose you are dropping probes straight down into the ocean to help map the ocean floor. A probe is deemed “uncontactable” [radio signals cannot reach it] once it drops at least 10000 feet under the water. A probe is deemed “unrecoverable” [your submarine can’t go pick it up] if it drops at least 20000 feet under the water. If you learn that the last probe you dropped is uncontactable, what is the probability that it will be unrecoverable? [WISE, Tables not tech]
2. I recently came across a post on a website for professional blackjack players. In it, the author was trying to help new players understand some of the probability and statistics that are part of the game. We’ll explore this post and fill in the mathematical details. While the intricacies of the game are not important here, it is useful to know that blackjack is a casino game in which a player plays against the casino and can win or lose money based on the strength of their hand (which is essentially random). It usually takes less than a minute to play a hand. How much you win or lose on a hand depends on many variables (e.g., the amount you bet, the rules of the casino, how you play hands, etc.), and typically, professional players are most interested in their EV (expected value), measured in dollars won/lost per hour of play.
a. [1 point] To determine the EV of a blackjack player, it is easiest to plug the house rules and betting strategies of the player into a simulator that plays millions of hands and then averages the wins and losses to determine the EV. Using results from such a simulation, the online post I read set up a random variable for the amount a professional player will make in an hour. This amount is normally distributed with mean $87 and standard deviation $942. (i) Why is a simple (unweighted) average used when finding the EV via a simulation instead of the weighted average seen in the definition of expected value? (ii) What result from probability theory explains why the hourly winnings should be roughly normal?
b. [2 points] The post goes on to consider a typical “gambling trip” wherein a player will get in about
25 hours at the tables. The author claims that over a gambling trip, one should expect to make, on average, $2175, but that results will vary, with a standard deviation of $4710. Explain how to get the numbers 2175 and 4710. [WISE]
c. [4 points] The post continues by considering a gambler who takes 12 “gambling trips” in a year, one each month. The gambler might record the result of each trip in a “year-end summary” like this (where positive values mean you made money on the trip from that month, and negative values are losses):
930 ﹐ -2914 ﹐ 7501 ﹐ 6463 ﹐ 308 ﹐ 3472 ﹐ 2271 ﹐ 3433 ﹐ 10552 ﹐ 3977 ﹐ 4485 ﹐ 7591
When the author simulated 10 such “year-end summaries”, they found that every single year-end summary contained at least one negative result. (i) Use R to generate a single “year-end summary” like you see above (you don’t have to round to the nearest dollar). (ii) Find the probability of the poster’s observation: That all ten “year-end summaries” contain at least one negative “gambling trip” . (Do not write a simulation to find this answer, although you can certainly check your answer using one.) [WISE, Tech not tables]
d. [1 point] The post concludes by noting that it was typical to see about 4 out of the 12 results in a “year-end’ summary” be losing results. On average, how many of the 12 “gambling trips” should result in losing money?
3. A student recently recommended the book “Algorithms to Live By: The Computer Science of Human Decisions” by Christian and Griffiths. In Chapter 2, the authors mention how much of what you see online (e.g., the color of a banner, the words on a clickable button) has been exhaustively tested to maximize the goals of a website (e.g., the time you spend there, the amount of money you spend, etc.). One interesting example of this comes from the 2008 Presendential election. Obama’s team hired Google data mastermind Dan Siroker to maximize the political contributions brought in from the donation subpage of Obama’s website. Siroker began an exhaustive analysis of what word(s) to put on the button users would click on to give money to the campaign. Obviously, there are many options: Donate, Donate Now, Please Donate, DONATE, Contribute, Support, etc. Imagine you’re an intern with Siroker’s team and have been tasked with deciding whether capitalizing has an effect on the average amount people donate on Obama’s 2008 site. Over the course of several weeks, you select random visitors and either render the donation webpage with the word “Donate” or the word “DONATE” on the contribution button.
a. [1 point] Offer a believable reason why capitalizing might lead to a high average donation, and a separate reason why it might lead to a lower average donation. This sets the stage for a two-sided alternative hypothesis below.
b. [5 points] Using the below data, conduct a hypothesis test with a significance level of 0.04. [PHAN- TOM, VIZ, Tech not tables]
|
|
“Donate” on Button |
“DONATE” on Button |
|
Mean Contribution |
$43.21 |
$40.67 |
|
SD |
$17.27 |
$19.12 |
|
n |
344 |
351 |
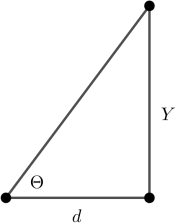
4. Suppose a random angle, Θ, is generated using a uniform distribution on the interval o0 ﹐ ![]() 、. We then draw a right triangle with base d > 0 (a known constant) and angle Θ (see picture). Note that for different values of Θ, we get different heights, y , for the triangle. After taking Math 180A, you can show that y
、. We then draw a right triangle with base d > 0 (a known constant) and angle Θ (see picture). Note that for different values of Θ, we get different heights, y , for the triangle. After taking Math 180A, you can show that y
is modeled by the pdf
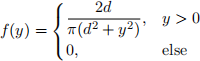
a. [3 points] Show that f (y) satisfies the two requirements of a pdf. (As ever, beautiful notation is required on all parts of this problem.)
b. [3 points] Show E(y) = >. (This shows that even simple scenarios can give rise to a CRV with infinite expectation.)
[4 points] 5. On Friday, January 29, 2021, X Games made its return after nearly a year off because of COVID-19. As a snowboarder myself, it’s my favorite sporting event of the year. This year, I made a list of features of the event that could be modeled by different distributions we’ve studied. For each of the below features, pick the most reasonable distribution to model it and provide a brief reason for your choice. (The only allowable choices are: Bernoulli, Binomial, Geometric, Poisson, Negative Binomial, Uniform, Exponential, or Normal. An answer may be used more than once or not at all.)
a. The age of a random competitor (where age is an integer)
b. The amount of time a random snowboarder spends in the air when going off the Big Air jump
c. The number of attempts a random athlete will need in warmups to land a specific trick (that they prepared for the event) a total of 6 times
d. Whether a random athlete remembers to put their COVID mask back on after finishing their run
[4 points] 6. These days, sorting algorithms are everywhere in our lives. Google returns webpages sorted by relelvance. Contestants on the Bachelorette are sorted by the main character’s interest in her suitors. Access to the COVID-19 vaccine sorts people by priority. This problem considers an actual sorting setting that was, in part, responsible for the creation of the company IBM.
Suppose you have 10 different pairs of socks (20 socks in total) which have been cleaned and are now mixed together in a laundry bag. You need to pair each sock with its partner so you adopt this plan:
· Step A: Reach into the bag and grab a random sock. You’ll work to find its match.
· Step B: Reach into the bag, grab a random sock, and see if it’s a match. If so, great! Return to Step
A and find a new sock that needs its match (unless you’ve finished all the socks). If not, put the sock back in the bag (!!!), mix things around, and grab another random sock. Continue this process until you get a match.
Any time you reach into the bag (in either step A or B), we’ll call this a “pull” . How many pulls, on average, will it take to get all 10 pairs matched up using this strategy? [WISE]
(The story is that a guy saw his college roommate using this strategy and was so bothered by the in- efficiency of it that he decided to study sorting algorithms. His studies led to improvements in the theory of sorting, upon which he formed a company, which ultimately became IBM!)
7. Cheating, Cheating Everywhere?! These days, claims of cheating are rampant. You see this in politics, in e-sports, and in academia. This raises the question: What percentage of college students actually cheat and has this increased because of remote learning due to COVID? Prior to COVID, between 70% and 95% of college students admitted to cheating (yes, you read that correctly). We’ll be cynical and set the pre-COVID college student cheating percentage at 95% for this problem.
a. [2 points] Suppose you plan to do a new study and want to build a 98% confidence interval that has a margin of error of 0.5%. What sample size should you draw if we use the value 95% in our planning process? [Tables not tech]
b. [5 points] Suppose instead of a confidence interval, we decide to run a hypothesis test to check if the cheating percentage has increased. If we want to use a significance level of 0.02 and have a power of (at least) 0.95, what sample size will we need to draw if the new cheating percentage is actually 97%? [PHN of PHANTOM, VIZ with two well-labeled curves, Tech not tables]
8. Rock-Paper-Scissors is a game between two players, A and B, in which each chooses a symbol (either Rock, Paper, or Scissors) at the same time and a winner is decided by a simple rule set: Scissors beats Paper (because it cuts it), Paper beat Rock (because it covers it), Rock beats Scissors (because it smashes it). If both players choose the same symbol, they each re-choose (independently of decisions in the past) and compare symbols, and this process continues until a winner is declared.
a. [4 points] Suppose player A randomly chooses based on the probabilities 0.5 (Rock), 0.3 (Paper), and 0.2 (Scissors). If player B randomly chooses their symbols based on the probabilities 0.2 (Rock),
0.2 (Paper), and 0.6 (Scissors), find the probability that player A eventually wins the game. Give an exact answer in simplified form. [WISE]
b. [5 points] Suppose an observer questions whether player A is actually choosing symbols using the setup in part a, and so they record A’s choices across many matches getting these results: 93 Rocks,
35 Papers, 32 Scissors. Conduct a hypothesis test using α = 0.02 to explore the observer’s concern. [PHANTOM, Tables not tech]
2023-03-20