MCEN90032 Sensor Systems Workshop 1
Hello, dear friend, you can consult us at any time if you have any questions, add WeChat: daixieit
MCEN90032 Sensor Systems
Workshop 1: Developing a Pedometer using Your Smartphone
Weeks 1–4 (10 marks)
1 Introduction
In this project, you will play with the motion sensors in your smartphone to generate a pedometer 1. In particular, the multi-axis accelerometer equipped in the smartphone will be used to generate the measurements of acceleration signals when you are walking. You will be using the Matlab mobile application on your smartphone to access the data measured from the multi-axis accelerometer equipped in the smartphone.
It is highlighted that this workshop is designed for each individual and will be assessed individually.
The project consists of 3 parts.
Part 1 You will learn how to obtain the data measured from your smartphone to desktop Matlab to be further analyzed. This part contains the following steps:
• You will learn how to install Matlab mobile, which is an application available from both Apps on Google Play and the App Store.
• You will learn how to log data from the needed sensor to a local drive.
• You will learn how to import the measured data to desktop Matlab.
Part 2 You will learn how to process the data from a sensor’s measurements and how to use the measurements to calibrate this sensor.
Part 3 You will learn how to utilize the multiaxis accelerometer to measure some physical variables. In particular, you will develop a pedometer based on the data gathered from the multiaxis accelerometer.
The marks for the project are distributed as follows
1. Project Demonstration (4 Marks). You need to show your solutions (your pedometer) to the lab demonstrator at the workshop at Week 4.
2. Project Report (6 Marks). You need to submit a written report for Workshop 1.
This report is due 11:59 pm on Sunday the 2nd of April, 2023 through Canvas.
1.1 Learning objectives
This workshop is designed with the following learning objectives:
• Get to know how to use Matlab Mobile App.
• Analyze and process signals measured from the sensor.
• Develop a pedometer using the data from the smartphone’s accelerometer measure- ments.
1.2 Components Required (minimum)
1. A Matlab account, if you don’t have one, you can register at the following website
2. An Android or iOS Smartphone.
2 Project Instructions
2.1 Part 1: Get to know how to use Matlab Mobile
MATLAB mobile is an application, which can read data from multiple sensors on the smartphone and save it to a local drive or stream it to MATLAB Online. It also can upload local data files to MATLAB Drive for off-line processing in desktop Matlab.
You might find the following two websites useful for downloading this application.
In this project, we will use the application to access the data measured from the multiaxis accelerometer in your smartphone. You need to save the measured data to a local drive, upload it to Matlab Drive, and download it to your laptop and process it in desktop Matlab.
In Part 1, you need to learn how to record and save the data from build-in sensors of your smartphone.
2.1.1 Data recording
1. Press the menu icon in the top left corner.
2. Select Sensor.
3. Set Stream to “log”.
4. Set an appropriate Sample rate.
You might find the following website, which explains the concept of sampling, useful:
Please think carefully about how to choose an appropriate sampling rate for a pe- dometer (why not too high and not too low). In your report, you might want to explain your selection.
5. Enable Acceleration and other sensors as you need.
You might want to check whether you want other sensors or not.
6. Press START.
7. Press STOP after the data collection.
8. Name the log and press SAVE.
9. Press Sensor logs, after a few seconds, you should see a “green cloud” icon, indi- cating that the log has been uploaded to your Matlab Drive.
10. Sign in the Matlab Drive on your laptop to download the log you just created.
2.2 Part 2: characterize and process acceleration signals
After Part 1, you should be able to access to the signals from built-in sensors of your smartphone. In particular, we are focusing on acceleration signals. In Part 2, you will
learn how to characterize the process the acceleration signals.
Part 2 includes the following steps:
• A simple calibration of data. Sensors and measuring systems, among other mea- surement tools, are calibrated to check their accuracy and repeatability. Calibrated sensors are necessary for precise, consistent, and repeatable measurement outputs. Calibration is one of the crucial conditions for effective quality assurance.
The simplest way to do sensor calibration is the comparison of the desired output (true values) and the measured output.
Can you think of a few simple ways to calibrate your acceleration signals?
• Characterization of its frequency components; Each signal has its frequency compo- nents, which will represent how fast this signal change. It is a very useful concept for engineers to characterize the signals.
You might find the following website useful for frequency components. Wikipedia - Frequency domain.
Most signals have a finite range of frequency components. Thus, by knowing the frequency range, you might filter out unwanted signals, whose frequency range is outside this known frequency range. This is called filtering.
• Using an appropriate filter to filter out unwanted signals. This step will process the
data using filtering techniques.
Next will explain each step in details.
2.2.1 Sensor calibration
While the application is active, observe the readings of your accelerometer, which is shown in Figure 1.
You might find a more detailed introduction of the accelerometer of your smartphone from the following website.
https://www.credencys.com/blog/accelerometer/
Before you use any sensor, you need to first calibrate your sensor. Sensor calibration is an adjustment or set of adjustments performed on a sensor or instrument to make that instrument function as accurately, or error free, as possible. In other words, you might want to compare the measurements of the sensor with the “true”value.
You might want to follow the steps to calibrate your sensor readings. Hint: these steps are not unique, other ways of calibration exist.
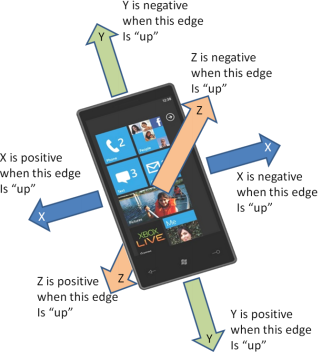
Figure 1: An accelerometer in a smartphone
1. Lay your phone flat on a horizontal surface, check the readings of the accelerometer.
2. Also check readings while changing the orientation of your phone.
3. Label all three axes (see Figure 1 for three axes) and remove constant bias from the signal by comparing it to the true value (when an axis is horizontal, the true value should be zero).
Exercise (optional): You want to use magnetometer in your smartphone to extract the magnetic north heading. For this task, can you figure out how to calibrate the sensor? As an engineer, obtaining the measured data from sensors is only the first step. You might need to show measured data to your manager or your customers. Then you need to show your data to them by plotting out the signal. This is called visualization.
2.2.2 Data visualization
1. Collect data while you do above steps.
2. Plot the acceleration from 3 axes and the norm of this acceleration signal against time, which is a 3-dimensional vector a = [ ax ay az ]T , where ax , ay and az are acceleration of X , Y , and Z respectively. The norm of the acceleration vector |a| = ^ax(2) + ay(2) + az(2)). To plot it against time, you might want to check the Timestamp property from the data file) in Matlab.
2.2.3 Data analysis and processing
In this part, you will collect a set of acceleration data during your walking. You need to analyze and process the obtained data.
Please keep in mind, in Week 2, you will lean the frequency analysis of a deterministic signal or a random signal. So if you are working on Part 3 in Week 3, you should know how to design a filter. You should know how to remove the noises of a signal using both analog filters (RC filters) and digital filters. Please revisit your lecture notes if you do not know how to design a filter.
Data Recording
For data analysis, we first record the acceleration data for fixed time of walking, for example, 30 seconds.
There are different ways to record data.
1. Put the phone in your pocket while walking. In this case, the acceleration data is affected by 1) the motion of the walking, 2) the change of orientation of the phone during the walking. This leads to Dataset 1.
2. Hold the phone in your hand and align the three axes of accelerometer to the ”human frame” (e.g., keep z-axis vertical, keep x-axis in the direction of walking). While walking, keep the orientation of the phone unchanged with respect to your torso. In this case (ideally), the acceleration data is only affected by the motion of the walking. This leads to Dataset 2.
Recording the acceleration data by using both methods and importing them into Mat- lab.
Frequency analysis
Acceleration data are contaminated by noises. The noise can come from various sources, which have different frequency components. For example, “drifting”, which is a non-zero reading when acceleration is zero, is the noise with a low frequency. On the other hand, white noises can spread in all frequency range.
A typical way to analyze the measurement data is to figure out its frequency spectrum. If the signal-to-noise ratio is relatively high, the range of the high peaks of the amplitude spectrum of the signal usually indicates the frequency range of the measured signal. This range can be used to design the frequency range for filters.
Another possible way to design the filter is to understand the physical principles of the signal. For example, the frequency of human walking is around 2 or 3 steps per second (varies among individuals). This information might be very helpful when you design the filter.
Please also note the following two facts of measured signals
• The signal after sampling is a discrete-time signal.
• You only collect the signal for 30 seconds of walking.
This suggests that the Discrete Fourier Transform (DFT) might be a good choice to obtain the frequency components of the acceleration signal. If you do not know what DFT is, please check your lecture notes.
The following steps are needed when you analyze the frequency component of the collected acceleration signal.
1. Calculate the Discrete Fourier Transform (DFT) of two sets of collected data (Dataset
1 and Dataset 2). You can choose to do it to one axis (e.g., z axis) of the acceleration or the norm of acceleration. Select either one you think best indicates the number of steps.
Hint: Use Y = fft(X) to compute DFT. After DFT, remember to use Y = fftshift(X) to shift zero-frequency component to center of the spectrum.
2. Plot the amplitude spectrum in the frequency domain for the two datasets. Compare the frequency spectrum of two dataset. You need to explain the possible reasons that can cause the differences between two amplitude spectra.
3. Optional Are these acceleration signals random signals? If they are random signals, are they stationary? If they are stationary, you might want to attempt to obtain power spectral density.
You might find the following link useful:
https://en.wikipedia.org/wiki/Spectral density
2.2.4 Processing the signal using digital filter
A digital filter is a system that performs mathematical operations on a sampled, discrete- time signal to reduce or enhance certain aspects of that signal.
In this section, the digital filter is used to filter out noises in the acceleration signals measured during your walking.
In this step, your task is to design a digital filter to filter out noises of two datasets. Plot the amplitude spectrum in frequency domain for the filtered data. Compare the spectrum of the original data and filtered data in both time and frequency domain.
Hint: To filter out low frequency “drifting” and Gaussian noise, it is recommended to choose a band-pass digital filter.
A simple way to obtain a digital filter is to “discretize” a RC filter. For example, the transfer function of a low-pass filter is
![]() H(s) = = (1)
H(s) = = (1)
where Y (s) is the Laplace transform of the output signal of the filter y(t) while U(s) is the Laplace transform of the input signal of the filter u(t). Consequently, this transfer function can be re-written as a differential equation using inverse Laplace transform
τy˙(t) + y(t) = u(t). (2)
You can approximate the y˙(t) as y˙(t) ≈ ![]() for any t ∈ [kTs , (k + 1)Ts ) where Ts is the sampling time.
for any t ∈ [kTs , (k + 1)Ts ) where Ts is the sampling time.
In a sequel, you can obtain the following digital filter from (1)
y[k + 1] = (1 − Ts )y[k] + Tsu[k]. (3)
Another way is to use some build-in function in Matlab. For example, you can use [b,a] = butter(n,Wn,ftype) to obtain the transfer function of a nth order Butterworth filter, and use it to filter out noises of your data. If you want to use these built-in filters, please check how these filters work. You need to explain why you choose a built-in filter in your report.
2.3 Part 3: build a pedometer using the accelerometer measure- ments
In this part, you will collect accelerometer data and build a simple pedometer by using the following steps.
1. Collect some walking data that would help you with developing the algorithm.
(a) Attach your pedometer (i.e. your phone) to yourself, using either of the two
methods mentioned.
(b) Press START to start collecting data and stand still for a while before you
start walking to collect some initial‘zero’readings.
(c) Then you can take a few (e.g., 20) steps at your preferred speed and then stop. Remember the number of steps.
(d) Wait for a few more seconds while you are standing still, then continue to walk for a few steps. Again, record the number of steps.
(e) Wait for a few more seconds while you are standing still before stopping the
data recording.
2. Calibrate the data using the first few steps.
3. Apply your designed filter to filter out the noises in the signal.
4. Develop an algorithm to count steps from the signal.
5. Plot the collected data, mark every detected step on the plot, and see if the total number of detected steps is the same as the actual number of steps.
Project Demonstration (40%): Show the results of your pedometer to the lab demonstrators in workshop at Week 4.
3 Project Report (60%)
Prepare a report as per the task given as a Portable Document (.pdf). Use an appropriate engineering report format. Your report should be no more than 8 pages with 12 pt font and it should clearly outline your methodology, results and discussion related to the tasks given in the project. You will be assessed on the following marking scheme for the report:
• Format: Is it in an appropriate engineering report format (include a proper introduc- tion, has figures and equations properly labelled, has references properly managed, etc)?
• Methods: Is the design clearly explained?
• Results: How accurate is the estimation of the number of steps? You can get a bonus mark if your algorithm is intelligent. For example, you algorithm will have the same code, which works equally well for e.g., different walking speeds, cadences, running.... To get the bonus mark you also need to explain what you did to make it intelligent.
• Discussion: Are the performance and limitations clearly analysed and described? Are the results and analyses presented in a way that clearly supports the effectiveness of the proposed scheme?
Submit your report as Portable Document (.pdf) and a zip file containing the raw data and code. Name the report and zip file with your student ID and submit to Canvas before the due date.
Late penalties apply at a rate of −10% (of the whole assignment marks) per day. Assign- ments submitted later than 5 working days after the due date will not be accepted and will receive zero marks. Only the last submission will be assessed.
Report submission checklist:
□ Report is no more than 8 pages
□ Report has 12pt font size
□ Report saved as PDF
□ Compress all materials into a .zip
□ Submitted file is named with your student ID
4 Academic Integrity
We take academic integrity seriously. Please note that while students may discuss and help each other in the thinking process, you should work on your assignments individually.
Details about academic integrity can be found at http://academicintegrity.unimel b.edu.au/. Please check with the tutors or the lecturer if you are in doubt. Ignorance is not a valid reason for academic misconducts.
2023-03-17
Developing a Pedometer using Your Smartphone