COSC 578 Midterm Exam (S2021)
Hello, dear friend, you can consult us at any time if you have any questions, add WeChat: daixieit
COSC 578 Midterm Exam (S2021)
March 24, 2021
Rule: It is an open book and open internet exam. But you are not allowed to discuss with any human in any manner.
Duration: 75 Minutes.
Q1. Bias-Variance Decomposition. [40 points]
1a) What is Bias-Variance Decomposition?
1b) Make use of Example 2.2.6 in SI textbook to derive details of Bias-Variance Decomposition in Equation 7.9 in ESML textbook.
1c) What is Bias-Variance tradeoff?
1d) Use an example ML algorithm to explain Bias-Variance tradeoff.
Q2. Evaluation. [30 points]
You recently read a paper. In its “Experimental Setup” section, it wrote:
“The TREC Web Track 2012 dataset consists of web queries and relevance judgments from the ClueWeb09-B document collection. We use relevance judgments from 2012 for test and the ones from 2011 for validation. The relevance judgments available from the remaining years of the TREC Web Track, i.e., 2009, 2010, 2013, and 2014 are used for training. Note that, while the TREC Web Track 2009–12 have been evaluated on the ClueWeb09-B document collection, the TREC Web Track 2013–14 have been evaluated on the ClueWeb12 document collection.”
2a) Is there any problem with this experimental setup? What is the problem? Explain in details.
2b) If you are asked to fix the issue and re-design the experiments, what you will do? List all correct methods that you know.
2c) Detail their mathematical formulations, and
2d) Compare their pros and cons.
Q3. Model Complexity. [30 points]
The figure below shows expected perfection error (orange), squared bias (green) and variance (blue) for two regression methods, k-NN and Linear regression, respectively.
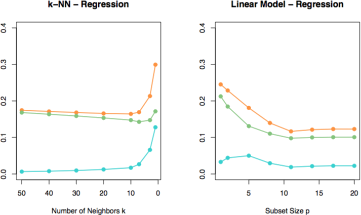
3a) What is the relationship among the three curves?
3b) As k increases, what do you observe? Why is it so? Justify your answer.
3c) As p increases, what do you observe? Why is it so? Justify your answer.
The figure below shows expected perfection error (orange), squared bias (green) and variance (blue) for two classification methods, k-NN and Linear classification, respectively.
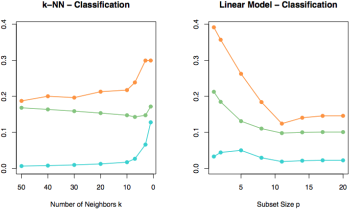
3d) What is the relationship among the three curves in the new figure?
3e) What is different between the two figures? Why is it so? Justify your answer.
2023-02-24