ECON8026 Advanced Macroeconomic Analysis Assignment 4 Semester 2, 2022
Hello, dear friend, you can consult us at any time if you have any questions, add WeChat: daixieit
ECON8026 Advanced Macroeconomic Analysis
Assignment 4
Semester 2, 2022
Question 1
Preference Shocks in the Consumption-Savings Model. In the two-period consumption- savings model (in which the representative consumer has no control over his real labor in-come yl and y2 ), suppose the representative consumer’s utility function is u(cl, Bc2 ), where, as usual, cl denotes consumption in period 1, c2 denotes consumption in period 2, and B is a preference parameter.
a. Use an indifference-curve/budget-constraint diagram to illustrate the effect of an increase in B on the consumer’s optimal choice of period-1 consumption.
b. Illustrate the effect of an increase in B on the private savings function. Provide economic interpretation for the result you find.
c. In the months preceding the U.S. invasion of Iraq, data shows that consumers de- creased their consumption and increased their savings. Is an increase in B and the effects you analyzed in parts a and b above consistent with the idea that consumption fell and savings increased because of a looming war? If so, explain why; if not, explain why not.
d. Using a Lagrangian and assuming the utility function is u(cl, Bc2 ) = ln cl + ln(Bc2) , show how the representative consumer’s MRS (and hence optimal choices of consumption over time) depends on B.
e. How would your analysis in parts a and b change if the consumer’s utility function were u(Dcl, c2 ) (instead of u(cl, Bc2 )) and you were told that the value D decreased? ( D is simply some other measure of preference shocks.)
Question 2
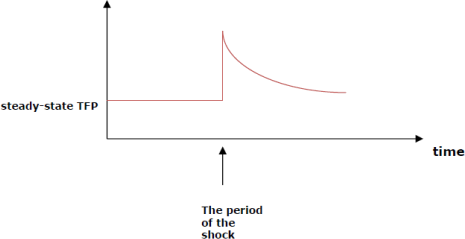
Impulse Response Function and Labor Supply: Part 1. Suppose a one-time TFP shock occurs, as shown below.
As we have studied, an increase in TFP leads to an outwards shift in labor demand (recall this from our firm analysis unit), which, as long as the upward-sloping labor supply function does not shift, leads to an increase in the real wage. Using an infinite-horizon (which, recall, is a heuristic for a “many, many, many time-period” framework) of the combined consumption-savings and consumption-labor framework (which is an extension of the brief two-period framework of Chapter 5), qualitatively plot an impulse response function for the representative consumer’s optimal labor supply that lines up with the impulse response
profile for TFP drawn above. Use the lifetime utility function
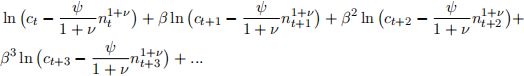
in which the utility parameters ψ > 0 (the Greek lower-case letter “psi”) and ν > 0 (the Greek lower-case letter “nu”) are exogenous to the representative consumer.
(You should be able to set up the appropriate budget constraints yourself, although you don’t need to display them if you don’t think you need to.)
Provide brief justification for the impulse response you have sketched.
2023-02-23