ECON20003 – QUANTITATIVE METHODS 2
ECON20003 – QUANTITATIVE METHODS 2
First Semester, 2021
Assignment 2
Due date and time: Monday 3 May, 10:00AM
Please read the following instructions carefully before starting to work on the assignment.
● There is a total of 100 marks for this assignment. It is worth 5% of the final grade for QM2.
● This assignment must be submitted online via the LMS by 10:00AM on Monday 3 May. Any assignment not submitted by this due date and time will be given a mark of zero.
● Students may work alone and submit their own assignment answers, if they wish to do so, or they can work on the assignment in pairs. In the latter case, each assignment pair must submit only one set of assignment answers and both students of the pair will receive the same mark for their assignment. It is not allowed to form assignment groups of more than two students.
● Please note that the assignment submission process has two stages:
1. Registering your assignment group (only if you work in a pair), and
2. Submitting the assignment online via the LMS.
Students who intend to work on the assignment in pairs must register their groups. To do so, click the “People” link and then the Groups tab in the Canvas course navigation menu. The group names (set by default) are A2 1, A2 2, A2 3 etc. Every assignment pair MUST register as one of these created groups for submitting the assignment and not create a new group. The deadline for registering your group is 5:00PM on Friday 23 April. If a pair fails to register their group before the deadline for group registration, both students will need to make an individual submission.
Students making an individual submission do not need to register.
● Answer the assignment questions using Microsoft Word. Make sure to include a cover page in the document with the student ID, the name, and the tutorial group of each group member. Paste your relevant R/RStudio scripts, screenshots, and printouts (graphs, output tables etc.) in the document. Convert the whole file to PDF before submitting it online via the LMS.
● Do not forget to preview your assignment after uploading on the LMS to ensure that you have indeed uploaded the correct and complete assignment, and that its formatting is in order as in their original document. Submissions that are late because of formatting issues or because a version is incomplete, will not be accepted.
Assignment Tasks and Questions
Exercise 1 (20 marks = 10 + 5 + 5)
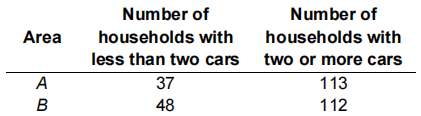
A market researcher believes that Area A’s proportion of households with two or more cars exceeds the proportion of Area B’s households with two or more cars. To see whether the facts support this hypothesis, the researcher conducts a survey among Area A and Area B households, with the following results:
(a) (10 marks)
Carry out an appropriate hypothesis-testing procedure ‘manually’ at the 10% significance level to see whether this survey supports the market researcher belief. Briefly discuss the steps of the test. Using the relevant critical value table, obtain and comment on the p-value of the test.
(b) (5 marks)
Use R/RStudio to test the market researcher belief at the 10% significance level. Comment on the test statistic value and on the p-value on your R printout. How do they compare to the test statistic value and p-value you obtained in part (a)?
(c) (5 marks)
What conditions are required by the test you performed in parts (a) and (b)? Are they likely satisfied? Explain your answer.
Exercise 2 (35 marks = 5 + 6 + 14 + 10)
“How can I lose weight?” According to a recent study by the Centres for Disease Control and Prevention (CDC), between 2015 and 2018 nearly one in five American adults older than 20 reported that they were following a particular eating plan on a given day.1 In response to this huge interest in weight-loss diet, not only in the US but in many other countries of the world as well, a large number of diet plans have been advertised on the internet. One of these programs, Slim as a Stick, was developed by a group of enthusiastic university students studying nutrition and dietetics. In order to demonstrate the effectiveness of their program, the students randomly selected 12 people and put them on their 16-week weight-loss diet. The weight of each participant was measured (in kilograms) and recorded both at the beginning and at the completion of the program. These measurements, labelled as Before and After, are saved in the a2e2.xlsx file. Your task is to find out whether these data provide ample evidence to conclude that Slim as a Stick indeed works.
(a) (5 marks)
What is the variable of interest? Is it qualitative or quantitative? If it is qualitative, is it ranked or unranked? If it is quantitative, is it discrete or continuous? What is its level of measurement? Explain your answers.
(b) (6 marks)
Given your answers in part (a) but without doing any preliminary data analysis, which tests do you think could be used to decide whether Slim as a Stick indeed works? Consider all relevant options and explain your choices.
(c) (14 marks)
What are the required conditions of the tests in part (b)? Are they satisfied? Explain your answer and provide as many supporting evidence as possible. Which of these tests do you consider to be the most appropriate to find out whether Slim as a Stick indeed works? Explain your choice.
(d) (10 marks)
Perform your preferred test with R/RStudio at the 5% significance level. Do not forget to specify the null and alternative hypotheses, to report your observed test statistic, to make a statistical decision, and to draw a conclusion.
Exercise 3 (45 marks = 6 + 9 + 16 + 12 + 2)
Do firms of different asset sizes tend to have different production costs? To answer this question, an economics honours student took a random sample of 24 firms categorized by asset sizes as Small (assets between $10 and $19.9 millions of dollars), Medium (assets between $20 and $49.9 millions of dollars) or Large (assets equal to or above $50 millions of dollars) and recorded their production costs (Cost) per dollar of net sales. These data are saved in the a2e3.xlsx file.
(a) (6 marks)
On the basis of the research question, the experimental design, the type and the measurement scale of the variable of interest nominate two tests that could be used to find out whether the three types of firms differ in terms of their average or median production costs per dollar of net sales. Explain your choices.
(b) (9 marks)
What conditions are required to validate the tests you nominated in part (a)? Which of these conditions are likely satisfied this time? Explain your answer.
(c) (16 marks)
Suppose that you are assured that all the requirements you mentioned in part (b) are satisfied. Which of the two tests do you prefer in this case? Perform it with R/RStudio at the 1% significance level. State the hypotheses, report the observed test statistic, make a statistical decision, and draw a conclusion.
(d) (12 marks)
Perform the other test you nominated in part (a) with R/RStudio at the 1% significance level. State the hypotheses, report the observed test statistic, make a statistical decision, and draw a conclusion.
(e) (2 marks)
Compare your conclusions in parts (c) and (d). Does it really matter this time which of the two tests the economics honours student relies on? Explain your answer.
2021-04-30